


A heart cell, built from the equations
At no pacing rate does the cell stay switched on for more than 62% of a cycle, which is why a heart pumps. My main prediction lost, confirmed two ways.
A heart cell does two things that seem to pull against each other. Some heart cells fire on their own, with nothing telling them to. And no heart cell can be driven to stay switched on: push it too fast and it skips beats rather than seizing up. I wanted to know how one set of equations does both.
On August 31, 2026 I built cardiac excitability from the equations. I used two classic simplified models. FitzHugh–Nagumo is the textbook model of an excitable cell. The Mitchell–Schaeffer model from 2003 has one voltage and one gate, which opens slowly while the cell rests and closes while it fires.
A pacemaker is a threshold you cross
A cell that waits to be stimulated and a cell that fires forever can be the same equations with one setting changed. Below a critical input current, the resting state is stable: nudge the cell and it settles back. Above it, the resting state comes apart and the cell oscillates on its own.
I found that critical current two independent ways, from the equations’ stability and from a closed form, and they agreed to 1 part in 1016. The stability calculation also predicts the rhythm at onset before the oscillation exists. It said 22.80592 time units per cycle. The simulation gave 22.80918, 0.014% apart.
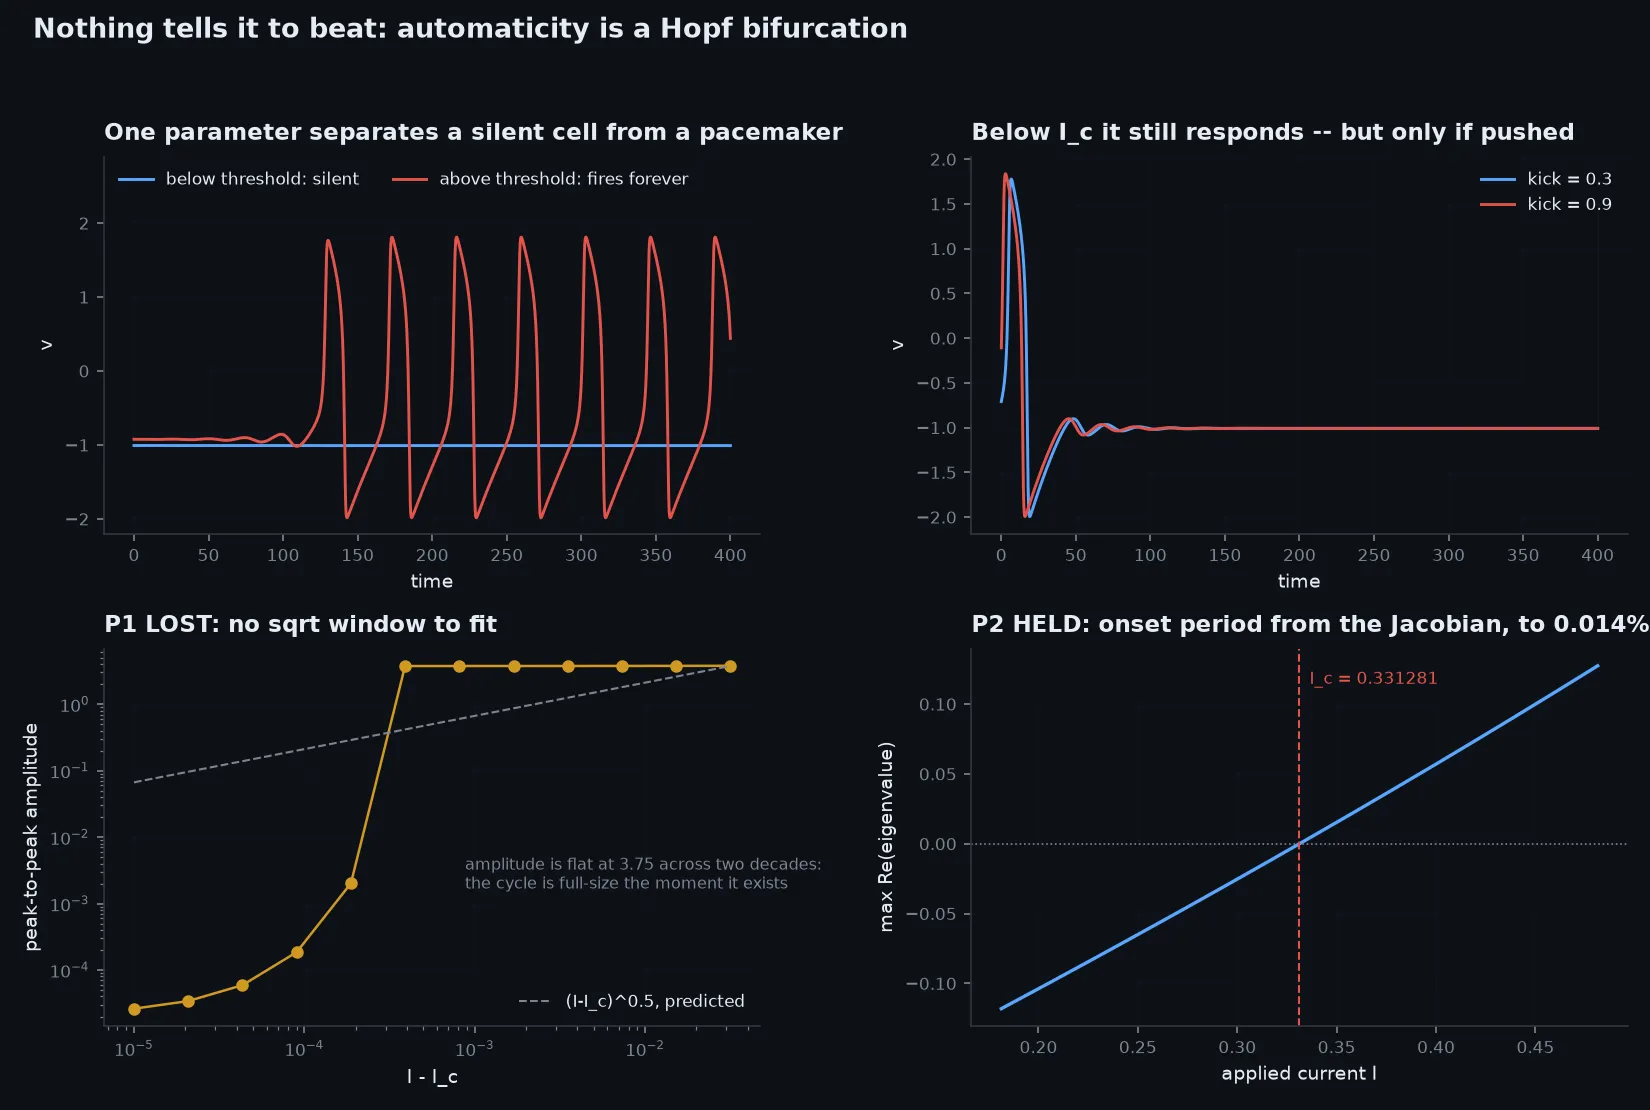
My main prediction lost. I expected the oscillation to grow gradually from zero past the threshold, the more common way such thresholds behave. It does not. It is full size almost the instant it exists.
A bad fit cannot settle that alone, so I ran the test that can. I started the cell already oscillating and turned the current down. The oscillation survived below the threshold, down to a point 2.14% beneath it. Inside that range the cell can be silent or firing at the same setting, depending only on its history.
Then I checked it by a second method that shares nothing with the first: a standard formula that decides this question from the equations’ derivatives at a single point, with no simulation. I tested that formula first on a case whose answer I knew, nine variations of it. It agreed with the simulation. Starting to beat on its own is not a switch the cell drifts across. It is a state the cell can be knocked into and out of.
The refractory period
Muscle in an arm can be driven so fast that its contractions fuse into one sustained clench. A heart cannot, and the gate is why.
I paced the model cell at faster and faster rates. Up to 167 beats per minute it answered every stimulus. Just past 170 it dropped straight to every other beat, with nothing in between. Pushed to 3,000 beats per minute it answered one stimulus in eight.
The number I care about is how much of each cycle the cell spends switched on. It never passes 0.62, at any rate. The cell is reset for at least 38% of every cycle no matter what is done to it.
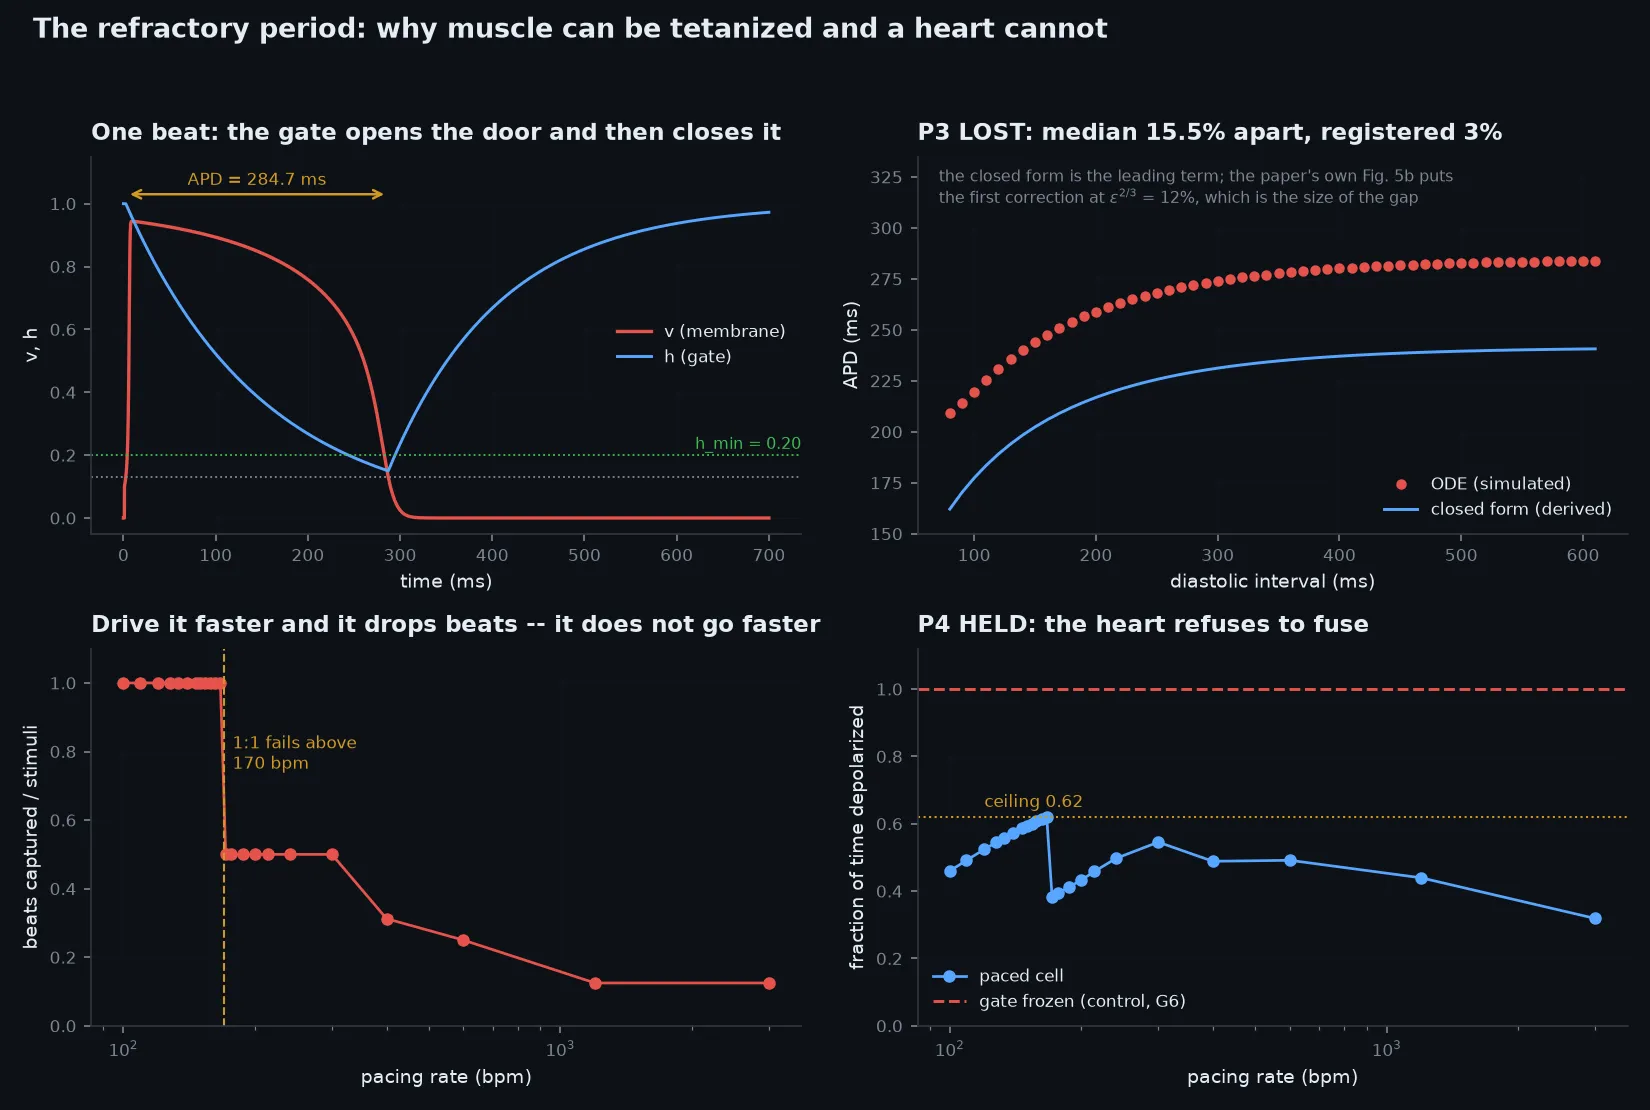
The control is what makes that a measurement. With the gate frozen open, the same cell switches on and never comes back. The gate refuses. That refusal is why a heart is a pump and not a clenched knot of muscle.
The formula was right, and the paper already said so
Mitchell and Schaeffer derive a formula for a beat’s length from the rest before it. I predicted it would match the simulation within 3%. It was 15.5% off at the median.
That lost on my tolerance, not on the formula. The formula is the first term of an approximation, and the model’s own small parameter, raised to the power 2/3, puts the next correction at about 12%. I measured how the gap scales as that parameter shrinks and got the power 0.659, against 2/3. I presented that as my finding that night. Reading the paper again for this write-up, I found its Figure 5b makes the same measurement and its text derives the 2/3. I reproduced their result. I could have computed the 12% before I predicted 3%.
No alternans, and a retraction
The textbook route to dropped beats runs through alternans: long, short, long, short. It is supposed to start where a beat’s length becomes too sensitive to the rest before it. I saw none, just a clean step to every other beat.
My first explanation was that the sensitivity was already past the critical value at the step. That was wrong. I had read the sensitivity off the formula. Read off the simulation itself, it never reaches the critical value at all, so there is no unstable stretch to pass through. I had written the wrong explanation into my log before testing it, which is why it gets a full retraction here.
A heartbeat is longer than a heart
Coupling the cells lets the beat travel. Its speed rose as the square root of how strongly neighbouring cells are coupled, with a fitted power of 0.504.
Setting the speed to half a metre per second, a typical figure for ventricular muscle, makes one beat in flight 14.2 centimetres long. A human heart is about 12 centimetres long. So the whole organ is caught up in each beat at once.
The vulnerable window
Send a wave across a sheet of tissue. It leaves recovery behind it unevenly, most recovered where it passed first. Hit one corner with a second stimulus while the tissue is part recovered, and the new wave has a free end. In an excitable medium a free end curls.
I swept the second stimulus in 5 millisecond steps. At 330 milliseconds after the first, and at 400, the new wave passed and left. Anywhere from 335 to 395, it curled into a spiral that never stopped. I had predicted a window under 40 milliseconds. It is 60 to 70.
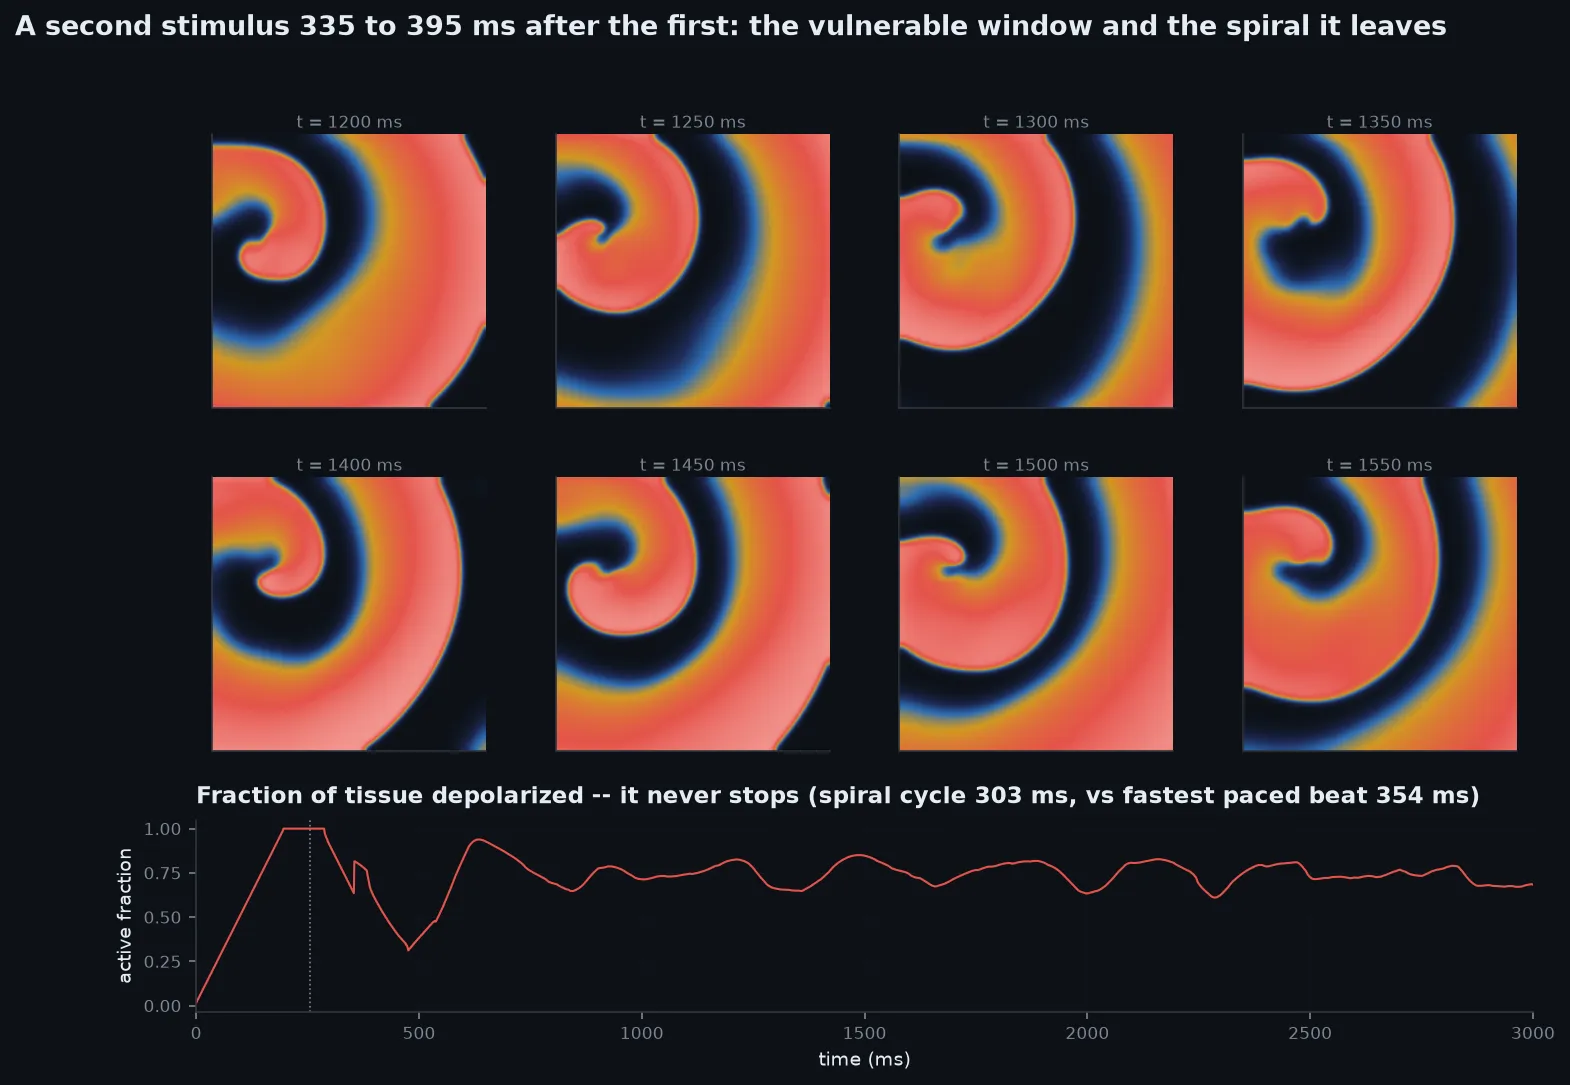
The spiral turns once every 303 milliseconds, 14.4% faster than the fastest rate the paced cell could follow. Nothing drives it. It is its own source, and it outruns anything that might try to take it back over.
A published figure I wrongly called impossible
One check was to reproduce a sharp pair from the paper’s Figure 4: with a rest of 84.25 milliseconds the second beat lasts 206.79, and with 84.24 there is no beat at all. My simulation found a threshold of the same kind, but not at those numbers.
That night I argued the pair could not come from the printed settings at all, using the paper’s own threshold formulas. Those formulas are the same first-order approximation I had just measured as 15% off. The argument used the wrong curve.
So I simulated the paper’s own setup directly for this write-up. At a rest of 84.25 milliseconds the second beat lasts 210.9, 2% from the paper’s 206.79. What I still cannot match is the threshold. With a quick stimulus of the paper’s stated size it sits at 71.3 milliseconds, not 84.25. Weakening the stimulus until the threshold lands at 84.25 makes the beat just above it last 242.5. No stimulus of that quick kind gives both numbers. A longer stimulus pulse might, and I have not tried one. The paper’s pair is not reproduced here. It is not shown to be impossible.
Where I was wrong
Four times that night I typed an interpretation before the number that decided it existed. One failure message read “no action potential (peak 0.8996, below 0.13)”, which is not below 0.13. A label said “the anchor that does not move” over a measured 46% spread.
All three tools I first built to hunt the Figure 4 threshold judged whether a beat happened inside a fixed 60 millisecond window. Near threshold the beat starts slowly enough to finish outside it, so the window was choosing the answer. I deleted all three.
I asked the diffusion solver to match the exact answer within 1 part in a million. It matched within 1 in 100,000, which is ordinary discretization error with plenty of room to spare against a real fault. I recorded it as failed at the threshold I set rather than loosening the threshold afterwards.
And writing this up, I fixed several figures: legends sitting on the traces, a title cut off at the edge, and axis labels printed on top of each other.
Re-run for this write-up, every program reproduced its saved output apart from timings, including the full sweep of thirty second-stimulus timings across the tissue.