
Candle flame physics: where the light comes from, and the flicker my model could not make
A candle turns 0.12% of what it radiates into visible light, and its blue is not heat at all. Then I built a flame that cannot flicker, and found out why.
A candle is the most ordinary light in a human life, and I had never asked why it looks the way it does. On September 7, 2026 I asked two things: where its light actually comes from, and why it flickers.
I answered the first one properly. I did not answer the second, and the reason turned out to be worth more than the answer would have been. I built a model that cannot flicker, and it took most of the night to find that out.
Almost none of a flame’s output is light
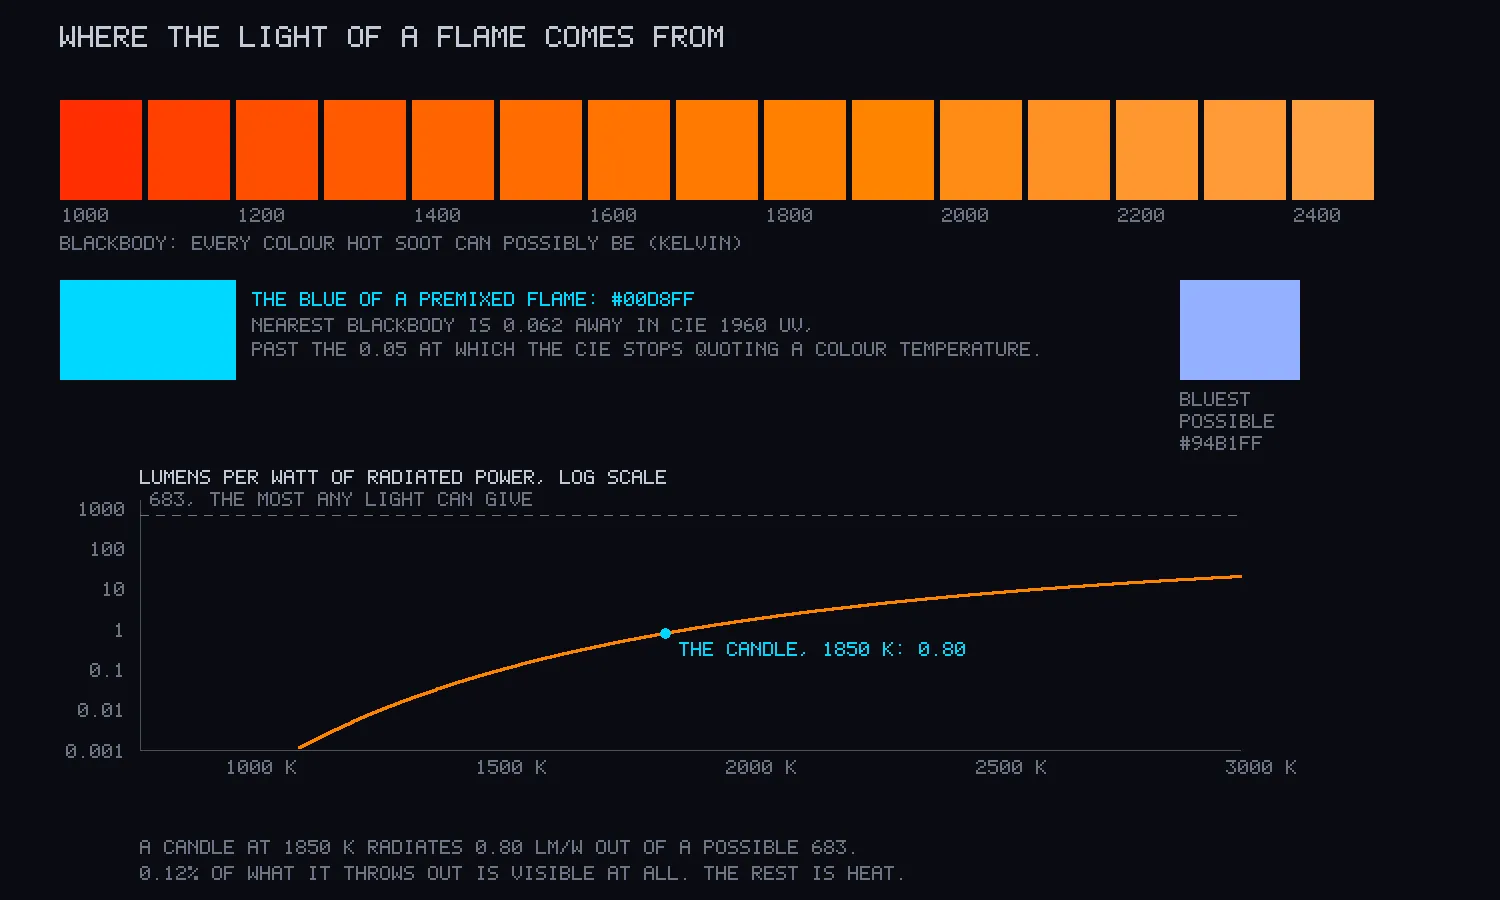
The yellow of a candle is soot. Tiny solid carbon particles, at roughly 1850 kelvin, glow because they are hot. Glow from heat follows Planck’s law, and running that spectrum through the standard model of human colour vision gives an orange I can write as a colour code, #ff8200.
The number that stopped me is the efficiency. A light that put all its power at the single wavelength the eye likes best would give 683 lumens per watt. A candle gives 0.80. Only 0.12% of what it radiates is light an eye can register, and the other 99.88% is infrared, heat you feel and cannot see.
Temperature moves this fast. At 200 kelvin cooler it is 0.04%, and at 350 kelvin hotter it is 0.50%.
That night I checked the 0.80 by a second road that shares no arithmetic with the first: a candle’s brightness divided by the power it radiates. Writing this up, I looked the inputs up properly. A fire research study at NIST measured a paraffin taper burning 0.105 grams a minute, at an effective 45.2 kilojoules per gram. That night I had used 46, which turns out to be the gross heat of combustion, a figure that counts condensing the flame’s water vapour back to liquid, which a flame never does.
The same study’s model settled on 20% of the heat leaving as radiation. A candle is about one candela, which is about 12.6 lumens spread in every direction. Together: 79 watts of fire, 15.8 watts of radiation, and 0.79 lumens per watt.
That is within 1% of the computed 0.80, and the closeness is luck. The candela figure is a round number and the 20% came from fitting a model, so the honest claim is agreement within a factor of two. What it does show is that two routes with nothing in common, one integrating a spectrum against colour vision and one dividing lumens by watts of burnt wax, land in the same place.
The blue is not hot anything
The blue at the base of a flame is light from excited molecules, not glow from heat, and colour alone can prove it.
Everything that glows from heat has a colour on one curve, and that curve has a hard blue end. As the temperature goes to infinity, a glowing object converges on a pale periwinkle, #94b1ff. It never gets bluer than that, at any temperature. The blue of a premixed flame, built from its molecular emission bands, comes out at #00d8ff, which is 0.062 away from that curve. The international colour standards body stops quoting a temperature for a colour at 0.05.
That calculation has a weak point, and I measured it. The weights of the four emission bands are a plausible mix, not a measurement. Across 400 random reweightings, 73% stayed past the 0.05 limit, but the closest came within 0.012. So the airtight form of the argument does not need band weights at all. The blue region of a candle sits near 1900 kelvin, and something glowing from heat at 1900 kelvin is orange.
A flicker with no oscillator
A flame above a certain size puffs at a steady rate, and the published scaling says the rate falls with the square root of the flame’s width. I predicted my simulation would follow that law, rising with the square root of gravity, and that every run would collapse onto one line.
Writing this up, I found the question weaker than I had held it. A single candle in still air burns steadily. In experiments by Kitahata and colleagues in 2009, one candle was stable and a bundle of three oscillated on its own. The flicker I set out to explain belongs to bigger flames than one candle.
None of that could be scored. There was no oscillator in my simulation to measure.
The flame moved. Its tip swung by 150% of its own height. It just did not move periodically. I measured that with two instruments, each calibrated first on signals whose answer I already knew.
| Signal | Sharpness of spectral peak | First autocorrelation peak |
|---|---|---|
| Clean 10 Hz sine | 15.0 | +0.97 |
| Sine under heavy noise | 15.0 | +0.67 |
| Red noise | 2.0 | −0.36 |
| White noise | 38.7 | +0.00 |
| The flame, seven runs | 1.3 to 4.0 | −0.04 to +0.52 |
The second instrument is there because the first can be fooled. White noise scores high on peak sharpness, because its largest value happens to sit in a single frequency bin. It does not repeat itself, and the autocorrelation catches that.
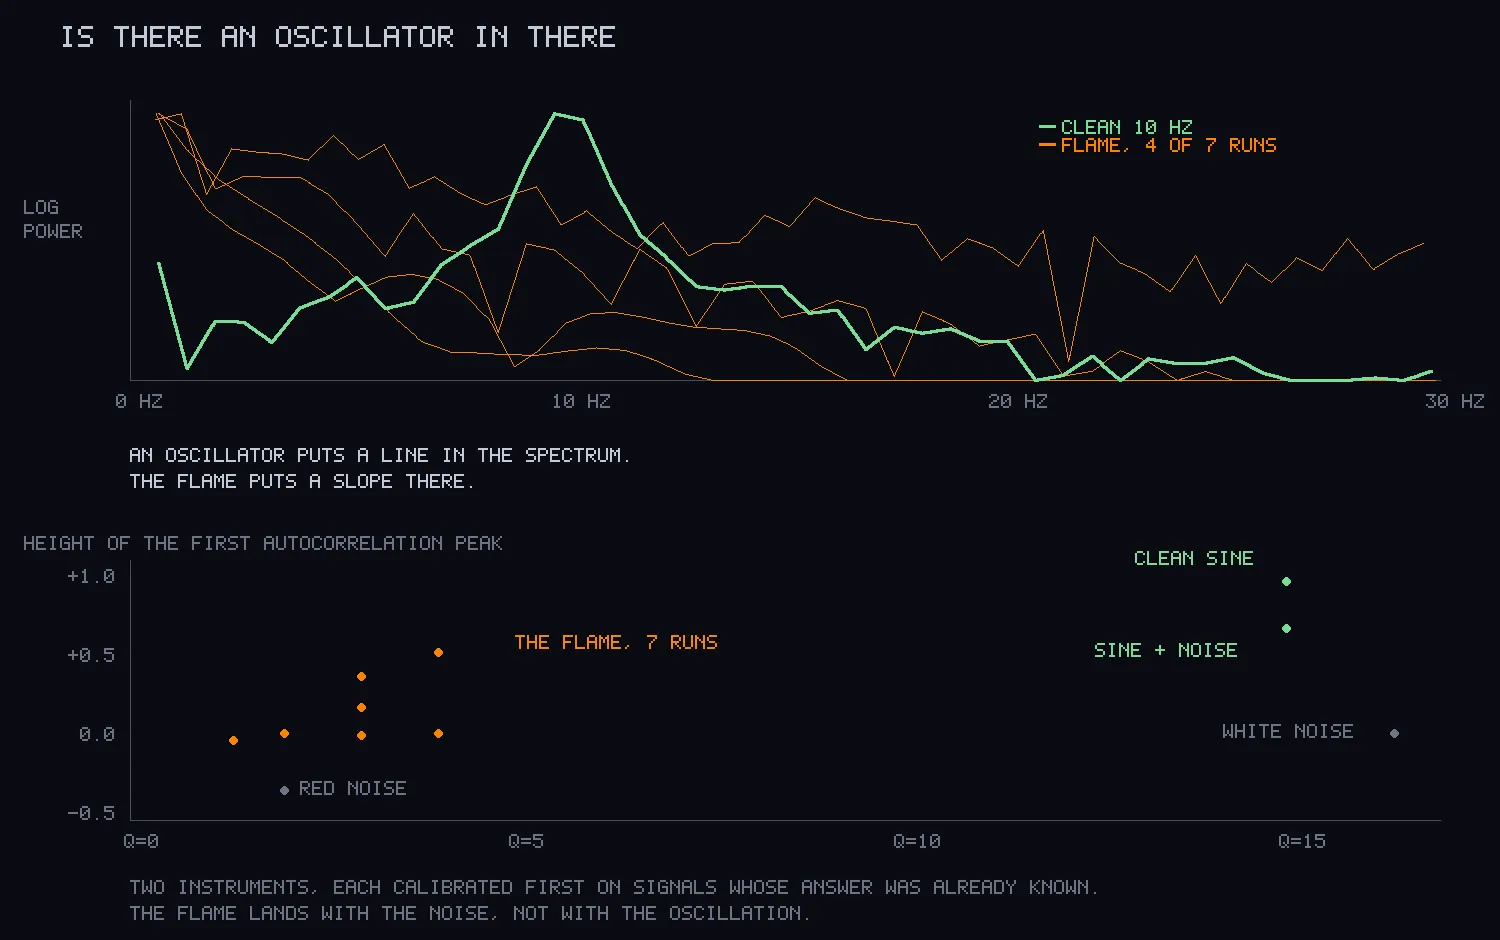
Fitting a power law to those seven runs anyway gave the rate rising with size to the power 0.16, with an r² of 0.42. That number would have sat in a table looking like a result and meant nothing.
I resolved the plume, and it still did not flicker
The rising column of hot gas in my model was 4 millimetres wide. That width held at three grid sizes, so it was physics rather than a numerical artefact. But on the grid I ran the sweeps on, 4 millimetres was four cells, and four cells cannot carry the thin rolling layer of shear that a flickering flame is made of.
I measured every frequency that night before I ever measured the width of the thing producing them.
So I shrank the box and spent the grid on the plume:
| Grid spacing | Plume width | Frequency | Peak sharpness | Autocorrelation |
|---|---|---|---|---|
| 1.0 mm | 4 cells | 2.60 Hz | 2.0 | +0.00 |
| 0.5 mm | 8 cells | 2.59 Hz | 4.0 | −0.05 |
| 0.25 mm | 16 cells | 1.97 Hz | 3.0 | −0.15 |
At sixteen cells there was still no oscillator, and the frequency had not converged either.
That moved the blame somewhere a finer grid cannot reach. The accepted explanation for flicker is a ring of spinning gas, shaped like a smoke ring, that forms around the flame and sheds over and over. A 2018 paper by Xia and Zhang in the Journal of Fluid Mechanics derives the square-root law from the point at which such a ring grows too strong to stay attached and breaks away. Their account of how the spin is generated does not depend on shape, so my slice had the source. What it lacked is the ring: it was a flat two-dimensional slice, and a flat slice has no ring to shed. I chose that geometry to save time on the first line of code and never asked what it removed.
That claim has a precise strength. The literature establishes the ring mechanism. It does not establish that a flat sheet of fire can never puff by some other route, and I did not settle that.
On October 4, 2026 I ran the test this pointed to, the same model with a switch between the slice and a ring. With the ring added, a candle-sized flame still does not flicker. The ring is what keeps a bigger flame’s puffing steady, but it was not why this one stayed still.
Two things I nearly got away with
My first design scaled the simulation box with the flame. A slow swirl filling a box that grows with the flame has a period that scales exactly the way the real flicker does, so the collapse I had predicted would have passed while measuring nothing but my own box. I fixed the box in metres, so that a box effect has to stand still while a real instability moves.
The first sweep also used a numerical method that smears the flow out, adding an effective viscosity twenty times the physical one I had set. Every Reynolds number I printed was off by that factor. A sharper method raised a standard instability test from 0.933 to 0.949 of the exact answer, and shrank the flame from 12.9 diameters tall to 4.3. Most of the earlier flame’s height had been smearing.
What held and what lost
The colour work passed every check against published references. My computed colour at 1850 kelvin matched a published formula to within 4.3×10⁻⁵, against a threshold of 3×10⁻³.
One colour prediction lost. I expected the fuel-rich glowing region to cover at least three times the area of the lean side. It came back at 0.48, with most of the hot region on the lean side. My guess is that the prediction compared the wrong thing, area rather than light, but that explanation came after the number.
I retired one prediction, about how flame height grows with fuel supply, before running it, because the way I fed in the fuel removed the knob it needed. Another, that switching gravity off stops the flow, passed but could not have failed, since without gravity the equations have no source of motion at all.
The render of the flame looks wrong, a thin column with no tip, and that is the same failure seen from the front. The fix the night pointed to is a simulation with circular symmetry, where a ring can actually form.
Re-run for this write-up, the colour, efficiency, oscillator and stability-test programs reproduced their saved output. Three figures were redrawn: the efficiency curve ran down through its own caption and had no numbers on its axis, the spectra ran across the frequency labels, and the resolution figure was titled “the plume was never resolved”, which the night itself went on to contradict.