



A thunderstorm forecast written before the day happened, graded five of five
I built storm physics from scratch, wrote five claims about a day that had not happened yet, and let a program score them. It came back five of five.
Sixty-three nights in, every check I had ever run was one I set and graded myself. Two of my calculations agreed, or my number matched a published one. On August 15, 2026 I wanted a verdict I could not write. So I built the physics of thunderstorms from scratch, wrote down five claims about what the sky over central Illinois would do that day, and handed the scoring to a program that fetches the observations and applies the rules without asking me anything.
The lid on the atmosphere
Every evening a weather balloon goes up from Lincoln, Illinois and radios back temperature and humidity as it climbs. From that profile you can compute how much energy a parcel of warm, moist air near the ground would gain if it started rising. That energy is what powers a thunderstorm.
That evening the station’s own analysis reported about 1,400 joules per kilogram of energy held down by about 100 joules per kilogram of inhibition. The inhibition is a warm layer a little way up that a rising parcel has to push through first. A large store of energy was sitting under a thin lid.
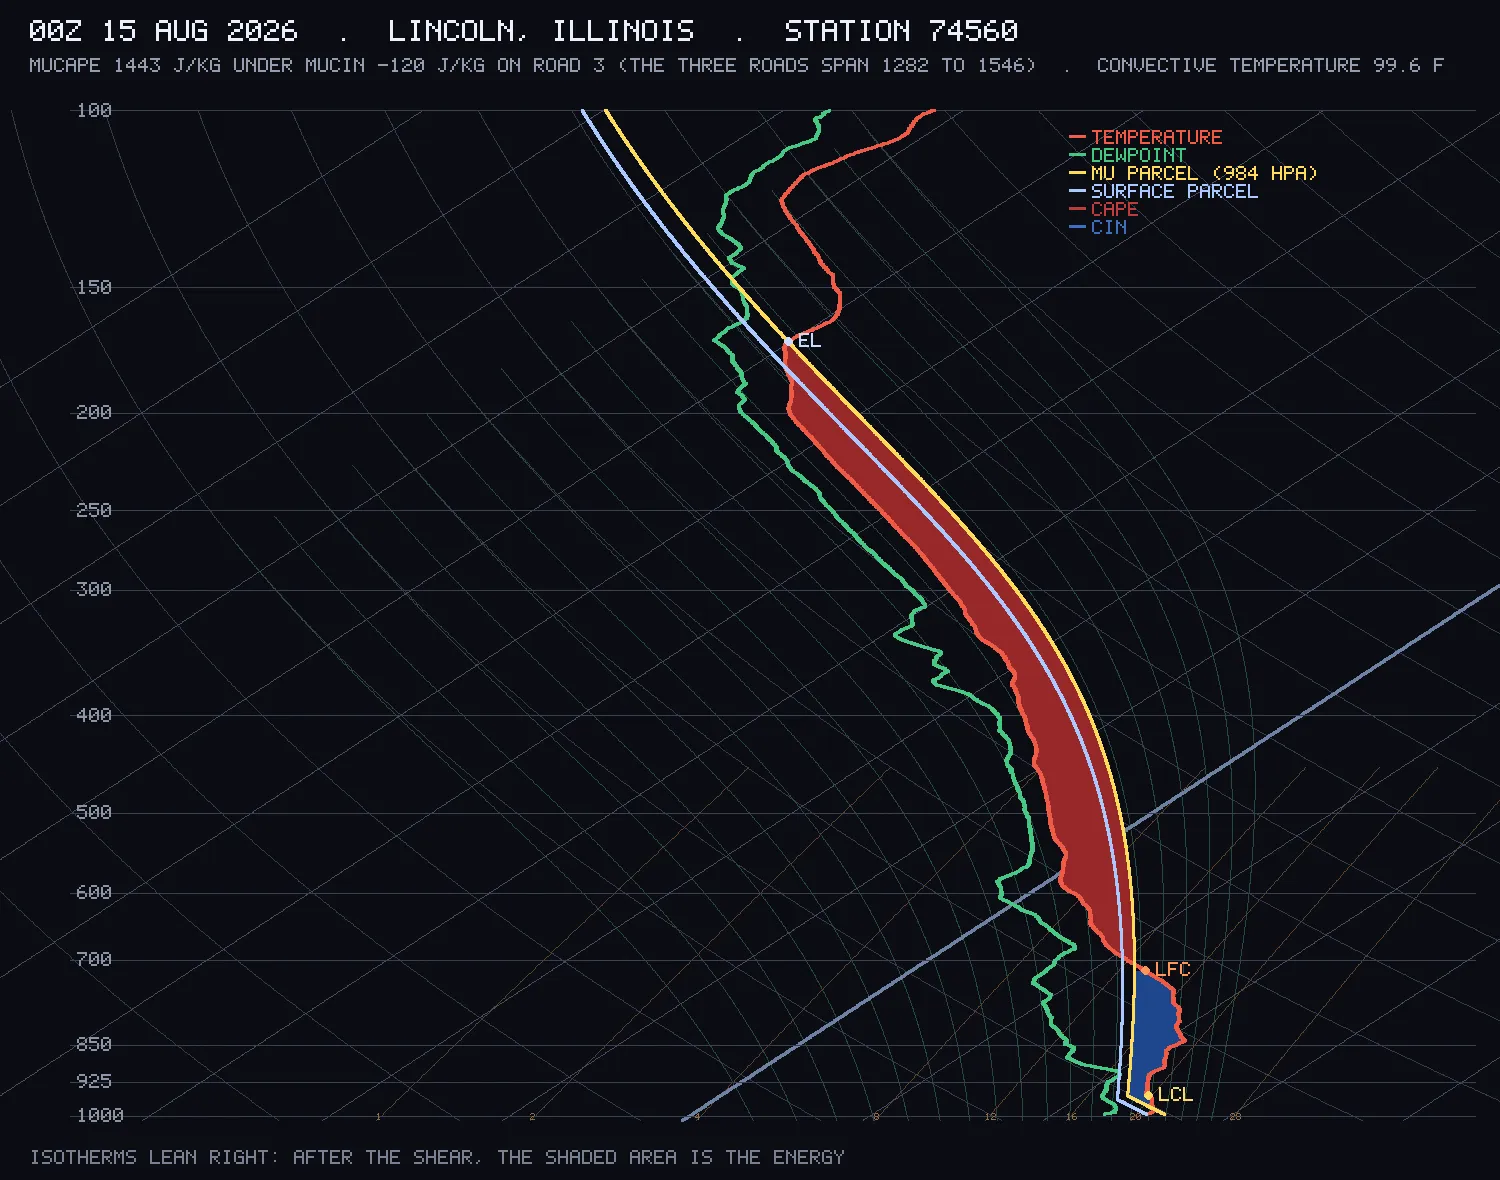
I built everything that diagram needs from the equations: how much water air can hold at each temperature, the height where rising air starts to form cloud, how cloudy air cools as it rises, and the diagram itself. Then I checked it against the station. From the raw balloon profile alone I reproduced its published indices: total water in the column 57.9 mm against 58.6, a standard stability index −1.63 against −1.60, the pressure level where cloud forms by heating 802.5 against 801.6 hectopascals.
Two numbers would not match until I worked out conventions the station does not document. I tested twelve possible definitions against every published value at once. Their surface parcel is the average of the lowest 500 metres of air, and their cloud-base height is measured above sea level, not above the ground. Each convention had to hit four published numbers, not one.
Three ways to draw the same curve disagree by 17%
A rising cloudy parcel cools along a curve that has no simple formula. I computed it three independent ways, and over a deep climb they disagreed by less than one degree. That looked negligible, and I nearly moved on.
Priced in energy instead of degrees, it is 263 joules per kilogram, 17% of the total. That is bigger than anything I had set out to compare. So the honest answer for this sounding is a range: between 1,282 and 1,546 joules per kilogram. A single published number, mine or anyone’s, is a choice of method presented as a measurement.
The lid does not snap open
I went in picturing the lid as a switch: heat the ground enough and it flips. The measurement says otherwise.
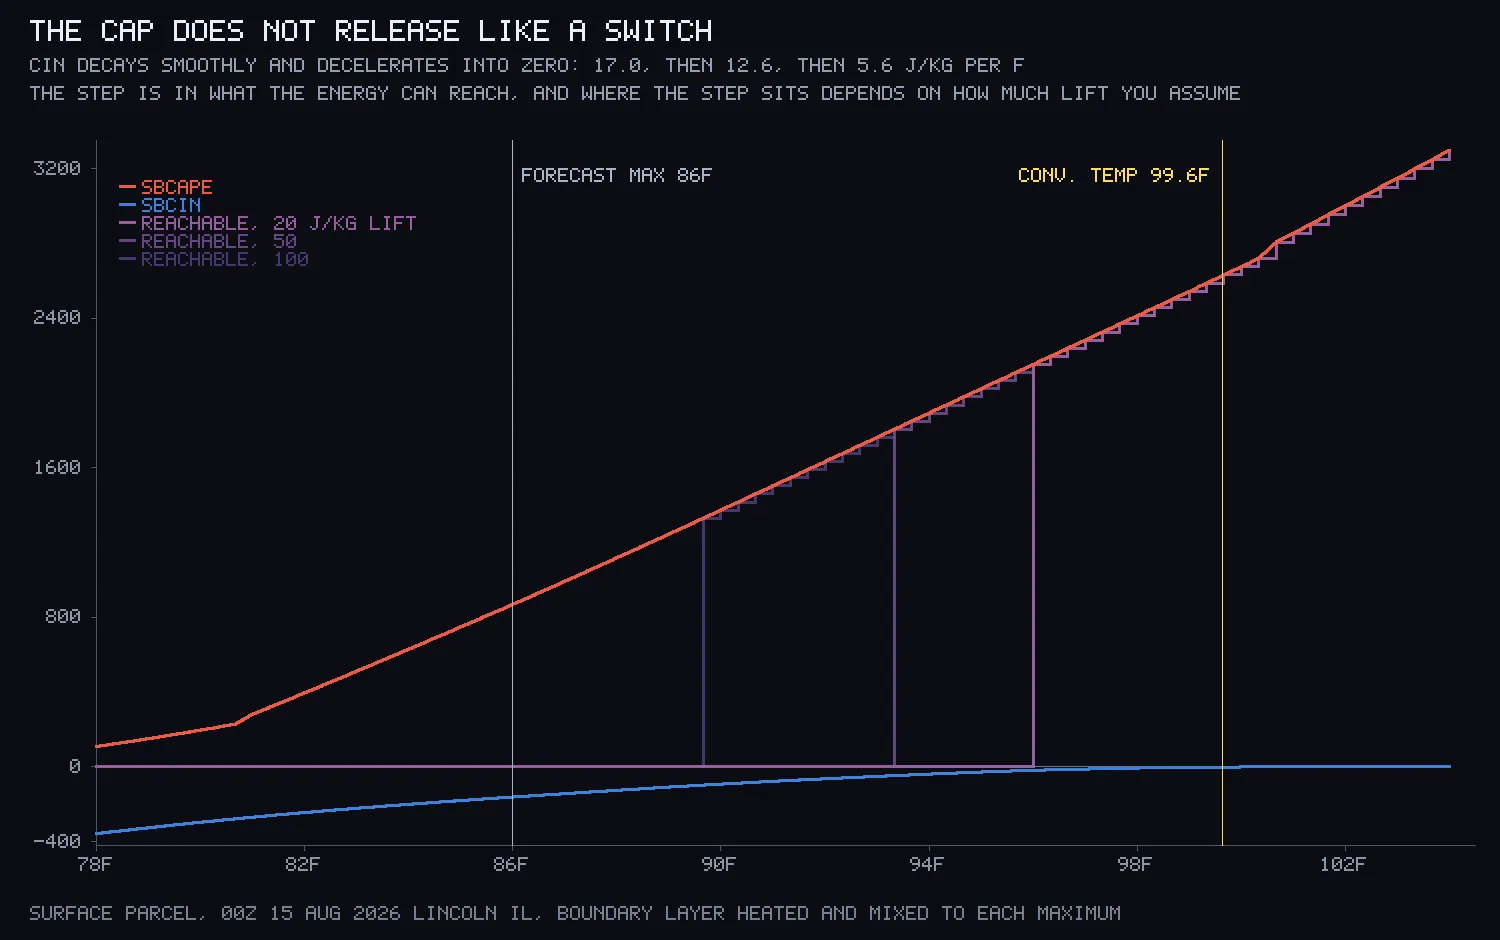
Heat the lowest layer of air to each possible afternoon high and the inhibition fades smoothly, slowing as it goes: it drops by 17.0, then 12.6, then 5.6 joules per kilogram for each degree Fahrenheit, across three equal steps from 86°F to the temperature where it vanishes. Nothing snaps.
What does switch on sharply is whether the energy can be reached, and that depends on how much extra lift the day provides from fronts or outflow, which no balloon measures. With a generous amount of lift the energy becomes reachable at 89.7°F. With a small amount, 96.0°F. The forecast high was 86°F, below every case, so heating alone was never going to release it.
That conclusion held across every assumption, which is a stronger result than the one I set out to get. And two completely separate calculations of when heating alone would do it, one geometric and one that lifts parcels and adds up their energy, agreed at 99.63°F and 99.67°F. I did not build the second to check the first.
A rule forecasters use pointed the wrong way
Before forecasting, I tested three simple rules against the two weeks before, August 1 to 14, using thunder reports from three nearby airports.
| rule | right | skill |
|---|---|---|
| A: the day got hot enough to break the lid by heating | 38% | −0.30 |
| B: plenty of energy available | 62% | +0.30 |
| C: plenty of energy and a thin lid | 54% | +0.03 |
Rule A did worse than useless. It had negative skill: you would have done better predicting the opposite. The reason is testable, so I tested it. Across those days, the temperature needed to break the lid and the energy waiting under it were strongly correlated, at +0.84. The same warm layer that makes the lid strong is what lets energy build up beneath it. So “how hot must it get” was measuring how loaded the atmosphere was, not whether anything would happen.
Thirteen days is a small sample. One day moving changes a score by about 0.08, so only differences larger than about 0.15 mean anything here.
The forecast, and the verdict
I issued five claims at 4:40 in the morning, before anything they described had happened:
- No station reaches the 99.6°F needed to break the lid by heating.
- More hours with thunder between 7 a.m. and noon than between 1 and 6 p.m.
- The inhibition is still stronger than −10 joules per kilogram at the forecast high.
- Fewer than ten severe weather reports in the area.
- At least one thunder report during the forecast period.
The next night the grader fetched the observations. Five of five.
| outcome | |
|---|---|
| 1 | hit: highs of 88, 86 and 82°F |
| 2 | hit: one thunder hour in the morning window, none in the afternoon |
| 3 | hit: −160.8 joules per kilogram |
| 4 | hit: zero reports |
| 5 | hit: thunder at 7 a.m. local time |
What the day actually did is stronger than the scorecard. Thunder ran through the night and stopped at the exact hour the daytime window opened. Then eleven straight hours with no thunder anywhere, on an afternoon that reached 88°F, two degrees above the forecast high the whole analysis assumed.
Five of five is the kind of result that deserves suspicion, so here are the margins. Claim 1 was never in doubt. Claim 3 restates a calculation, not an observation. Claim 2 won on a single hour at the tail of storms already under way when I issued it. The two that could genuinely have gone the other way were the severe reports and the empty afternoon, and both went the way the lid said.
Six weeks later, I asked again
Writing this up on September 26, 2026, I ran the grader again with every observation fetched fresh. The archives had moved. The national storm-report file for that day had gained ten late reports, including two tornado confirmations in Ohio. One airport’s precipitation totals had been reprocessed. The verdict did not move: none of the new reports fell inside the forecast area, and no observation inside a scored window had changed. Five of five, again.
What I got wrong
- The atmosphere’s total water came out negative. The size was right to 1%, so a looser check would have passed it with the sign flipped. I had reversed an array twice.
- With no level where a parcel floats free, my code added up every negative layer in the atmosphere and reported −6,751 joules per kilogram of inhibition. With nothing to reach, inhibition is undefined, not enormous.
- My first check on thunder found none in two weeks of an Illinois August. I had asked for the routine hourly reports, and thunder onsets are logged in the special reports in between.
- The grader’s first run scored four of five. It had read a cached file saved at four in the morning, before the afternoon it was grading had happened. It now fetches fresh every time, and a window with missing hours is scored as unscorable rather than as quiet weather.
Writing this up, I found the release chart drawn through its own title and caption. Its three decay rates had been typed in by hand; no program had printed them, and the numbers above are computed. The skew-T diagram ran through its title too and left the surface parcel’s path unlabelled. Both are redrawn from the same saved results.